


Visuals have become the lifeblood of content marketing. Users don’t want to read blocks of text. Instead, they’re far more engaged by a well-placed marketing infographic.
While marketers have considered infographics, and the visual medium as a whole, as little more than eye candy for users, that attitude is beginning to change.
But how and why should businesses design marketing infographic templates? We explain in this guide.
Marketing Technology News: Media Company Chooses WooRank to Broadcast Digital Strategy
What is a Marketing Infographic?
Human beings respond to visual stimuli more than auditory or experiential information. Infographics, which combine text, visuals, icons, and data, help users retain what they learn.
That’s why digital marketing infographics, like the example below, make for excellent visual learning tools.

Source: Venngage
This is an important note to remember for businesses that are budget conscious. The infographic cost is far outweighed by the leads generated and increased customer loyalty.
What are the Types of Infographics in Marketing?
Numerous types of infographics can be used in marketing. Here are five categories that are used in the marketing world most often:
- Statistical marketing infographics – data-heavy infographics
- Informational marketing infographics – text-heavy visuals that communicate concepts
- Funnel infographics – visuals that give an overview of projects and timelines
- Strategy infographics – graphics that highlight processes in marketing
- Social media marketing infographics – repurposed infographics shared on social media
The five categories have plenty of overlap. For example, this statistical infographic can be divided into smaller visuals to be shared on social media.

Source: Venngage
Now that we know which types of marketing infographics there are, how can marketers use them in their campaigns?
How are Infographics Used in Content Marketing?
You can use infographics in content marketing for a multitude of reasons. We’ve listed nine ways to use infographics below.
1. Visual Communication
One of the most important uses of infographics is for business communication. Marketing teams have a lot on their plate. It can get confusing deciphering roles and team goals.
A visual can help team alignment better than a video meeting or a chain of emails. For example, look at this strategy infographic that clearly explains how to leverage data for nonprofit success.
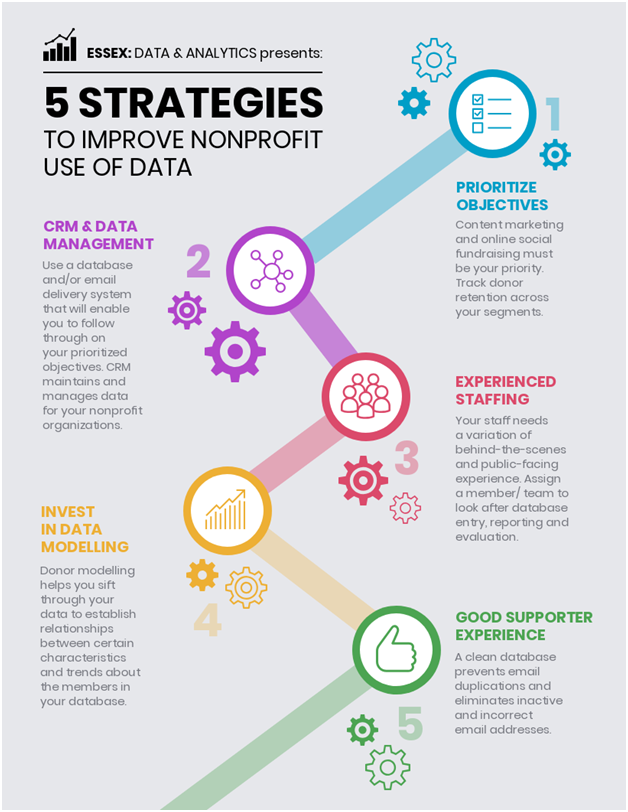
Source: Venngage
The details included in this visual could easily have been a two-hour-long meeting. But as an infographic, it’s succinct, memorable, and actionable.
Marketing Technology News:Iterate.ai Releases Interplay 6.0; the AI-Fueled Low-Code Platform Accelerates Application…
2. Data Visualization
Marketing teams live for customer data. Without data, marketers wouldn’t know who their customers are or how to reach them.
But as exciting as data can be, it’s challenging to share a data story with everyone. Numbers don’t always make sense on their own.
Combine those numbers in a chart, pair them with icons, add labels, and voila, you have an infographic that paints a clear picture.
For example, this market research infographic uses icons and donut charts to depict numbers. A user simply needs to glance at the visual to get the salient information.

Source: Venngage
Data can be confusing and alienating if presented on its own. When included in an infographic, it makes a powerful statement.
3. Landing Pages
Creating high-converting landing pages has always been a challenge for marketers. You want to give users the requisite information but you don’t want to overwhelm them.
Striking a balance becomes easier when you use visuals that captivate your audience and retain their interest on the page.
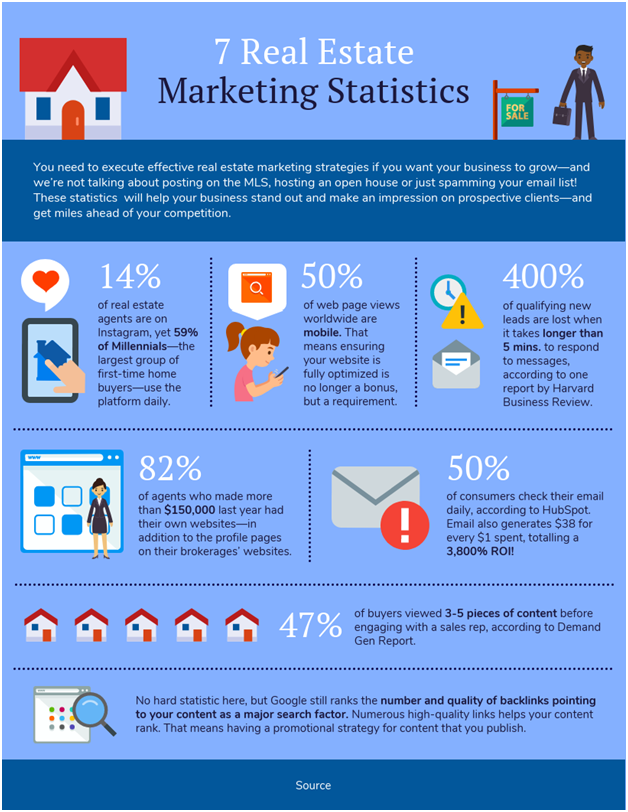
Source: Venngage
For example, this real estate infographic gives the user a large amount of information. But since it is relevant and attractive, the graphic encourages the user to stay on the page.
Other industries can create infographics to showcase their product’s benefits. Or to depict the process of using their service.
The sky’s the limit when it comes to using infographics on landing pages.
Marketing Technology News: Equifax Names New CTO for Canada to Accelerate Technology Transformation
4. Blog Posts
Digital marketing infographics have been used alongside blog posts for a while now. You can use an infographic to summarize your blog post. This makes the post easy to skim.
The infographic can also be used as a way to entice readers to stay on your post. Share the salient points in the infographic, with a prompt to get more details by reading the post.
5. Newsletters
A marketing infographic is a great visual to send to your database. While email marketing is still one arena where text has a part to play, visuals can have a major impact on customers.
For example, a list like this looks so much better as a colorful infographic, than it would have as blocks of plain text.
 Source: Venngage
People receive so many emails a day that your content has to stand out if you want to get noticed. Use infographics in your email marketing campaigns to make a statement.
6. Social Media
A social media marketing infographic can be a great way to attract audiences and boost follower numbers.
According to this survey on social media content creation, marketers spend a lot of time creating and collaborating on weekly posts. And there’s a reason why.
 Users on social media are constantly looking for content that educates them and improves their lives. To make the process easier, marketers should create more infographics.
But that doesn’t mean creating infographics every week.
You can divide a larger visual into multiple mini infographics or create horizontal visuals, like the below example, that don’t get cropped on platforms like Twitter or LinkedIn.
 Source: Venngage
For channels like LinkedIn and Instagram, divide your infographic into a slideshow or a multi-image post. This will make it easier for users to engage with your content.
Infographics can also be used for social media carousel ads. Use the same process of dividing the graphic into smaller images that fit the ad size.
7. Content Repurposing
Infographics are excellent tools for repurposing content. Existing material can be repurposed into an infographic. Alternatively, infographics can be repurposed into other types of content.
We’ve already mentioned how infographics can be divided into smaller visuals to be shared on social media. They can also be shared as newsletters.
Need a topic to base your infographic on? Use existing blog posts or videos to create visual content, as explained in this infographic.
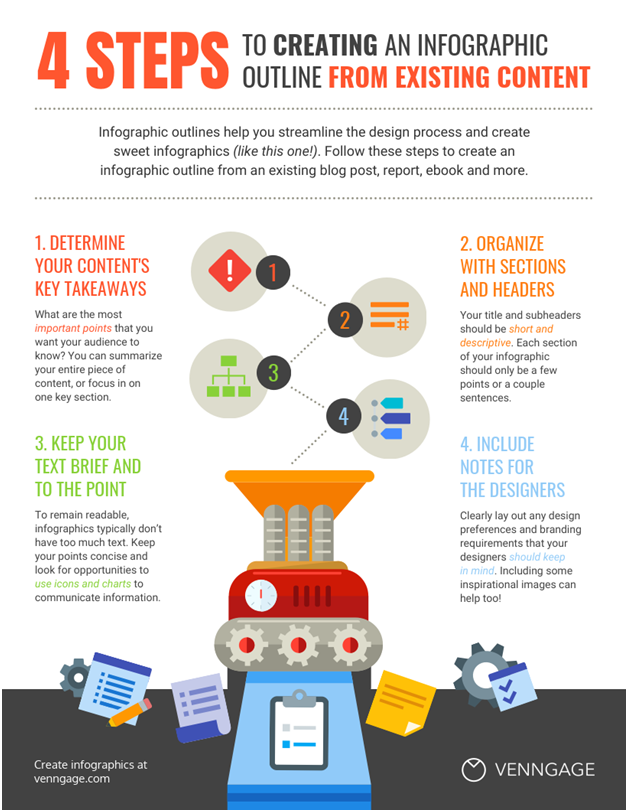 Source: Venngage
Have video marketing trends or statistics to share with your audience? You can create a video marketing infographic with charts. Pair it with a longer post explaining the important facts.
There are so many possibilities that marketers can explore with content repurposing and infographics.
8. Presentations
Make your presentations, slide decks, and slideshows more engaging by using a marketing infographic.
This is another method of repurposing infographics. Need to share an organization fact sheet with your team? Add an infographic like the one below in your presentation slide.
 Source: Venngage
Infographics can also help jazz up webinars and courses and boost lead generation. Attendees will find the content more interesting and memorable if you use visuals like infographics.
Marketing Technology News: Glassbox to Showcase their Digital Consumer Experience Innovations and Strength of the Adobe…
9. Building Backlinks
Marketers have had a lot of success building backlinks with infographics. Offering to collaborate with a company to create an infographic gives both parties value.
An infographic is also a great tool for cold outreach. Marketers are constantly reaching out to each other with offers of backlinks. Give them a reason to respond positively to your email.
Stand out from the crowd of outreach experts by offering an infographic to sweeten the pot.
What Makes a Good Marketing Infographic?
You now know how to use infographics to attract customers in the B2B world. But what makes a good marketing infographic?
Here are six simple principles to follow:
- Follow infographic design rules – don’t distort data, use white space around visual elements, and don’t overcrowd your graphic.
- Cater to your marketing audience – keep your audience in mind when creating graphics; leave out jargon but include a CTA.
- Use data storytelling in infographics – create visuals that tell a story and support your message; this makes it easier for the audience to recall your brand.
- Choose the right layout – there are numerous infographics layouts to choose from; pick the ones that suit your message.
- Research your strategy infographic – always spend time researching your infographic before you create it; find trustworthy data sources and then start designing.
- Choose the right charts – not every chart fits the purpose of the infographic; decide what the message of the chart is before inputting your data.
By following these rules, you can design infographics that are memorable and convert audiences.
Marketing Technology News: MarTech Interview with Clarence Kam, Chief Product Officer at JW Player
Conclusion
Digital marketing infographics have the potential to attract and retain audience attention. This is necessary in an online world that has become jam-packed with content.
Infographics can help a brand stand out from the crowd by making social media posts, newsletters, and backlink strategies more effective.


