 The Return On Investment (ROI) of a campaign is typically measured from percentage increase in revenue for commercial organizations that provide a tangible product or service to others.
In some cases, things are not that simple. Measuring ROI for public sector organizations whose objectives are to promote confidence and garner public support for their initiatives, it can be rather complex.
For such organizations, what works is measuring success through traditional methods such as surveys and focus groups that uncover insights of key stakeholders. However, traditional methods take days, weeks, or even months to gather data and perform the required analysis. Measurements through social media data allow organizations to gather data and react quickly, which is of utmost importance in this digital age, where a company’s reputation can be torn to shreds in a matter of minutes.
If you work in any organization that has a communications outfit, you might hear the following descriptors more often than you would like — Positive, Negative, Neutral. Or even things like “Positive-Neutral” or “Neutral-Negative.” These are some of the common ways to describe sentiment towards an issue or towards an organization. But even coupled with metrics such as volume of buzz, traction, and number of shares, it is still an arbitrary measurement of success.
What Is Wrong with Sentiments?
Some of the problems relying on social media sentiments are as follows:
- Ill-defined definitions – Human error often comes into play when defining sentiments due to the subjectivity of what constitutes a positive or negative remark, which changes according to (i) the people defining it; (ii) how closely related an organization is to the issue; (iii) the ability to understand local context and sarcasm. All these factors affect how sentiment can be effectively identified and tagged.
- The completeness of the dataset – There are over 10,000 public social media channels that are recognized in Singapore alone. Without a credible social media monitoring software, it is impossible for an organization to effectively monitor and measure all relevant opinions.
- The sheer amount of chatter – with over 500,000 public social media conversations in Singapore daily, some viral issues may easily chalk up 10,000 comments within a day. In such situations, it is not feasible for a communications team to look at all 10,000 comments to get the most accurate data.
- Spammers – Sentiments often do not account for “spammers.” They post a disproportionate number of times, skewing the overall results.
- What really matters – Sentiment numbers do not give context on a national level. What one organization defines as high traction of 100 negative comments could very well be a drop in the bucket for another dealing with a national-level crisis, with thousands of negative comments on the very same day.
- Real impact – At the end of the day, so what if this issue is defined as “negative”? How does the negativity of this issue impact the organization’s communications objectives or reputation? We should be using a far more systematic approach.
Read More: Tweet Your Way to Success: A Guide to Social Media Marketing & Strategic Thinking
Is There Still Value in Measuring Sentiment?
Social media sentiment is not a bad measurement to use. It still has a part to play in the larger scheme of things, as it is ultimately a measure of advocacy when done correctly. Here are some best practices that public sector organizations can use to extract the best value from their social media sentiment:
- Define your code book – Whether it’s towards the issue, your spokesperson, the key message or the organization, sentiments only work if there is a benchmark to compare with. Having a well thought out sentiment filter will add credibility to your output.
- Define your parameters – We have earlier concluded that monitoring everything on social media manually is an impossible task. Engage a reputable media monitoring company such as Isentia to effectively crawl all known social media channels. If not, carefully research and define the top channels you should be monitoring through relevance and social mentions.
- Always keep a baseline – To get a baseline, gather sentiments from recent months. Calculate the average number of comments and the average proportion of positive and negative comments. Plotted using a moving average indicator, this allows an organization to look at trends and identify a “negative” event.
Read More: The Era of Paid Social Media Promotions Has Just Begun
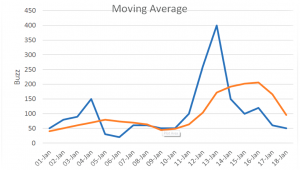 *Sample Chart 1 – Plotting buzz numbers across time and applying moving average indicator to maximize usefulness of sentiment data.
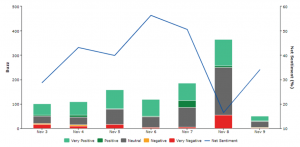 *Sample Chart 2 – Moving average for net sentiments.
So, What Now?
Taking a page out of one of the only books that I actually managed to finish (short attention span) — “How to Measure Anything” by Douglas Hubbard, “Anything can be measured. If a thing can be observed in any way at all, it lends itself to some type of measurement method. No matter how “fuzzy” the measurement is, it’s still a measurement if it tells you more than you knew before. And those very things most likely to be seen as immeasurable are, virtually always, solved by relatively simple measurement methods.”
The methods below each provide insights that simple sentiments cannot. They add a unique piece to the puzzle, in the hopes of being able to decipher more than what we already know.
1.Benchmarking
Benchmarking is the easiest way to provide context to any situation. It is quick, simple, and often provides a fresh perspective to any issue. Benchmarking against yourself provides quantifiable, actionable measurement of who, what, where, why and how the sentiment/numbers shift across time periods.
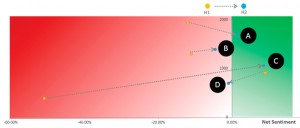 *Sample Chart 3 – Benchmarking and monitoring shifts in sentiments across the first half (H1) and second half (H2) of the year. Insights can be drawn from reasons for these shifts, as well as how competitors have shifted.
Another way to benchmark is to compare your issues to those at a national level.
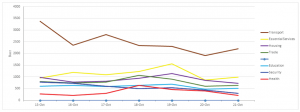
*Sample Chart 4 – What are netizens talking about on a national level. A potential “crisis” regarding healthcare on 18-Oct is still considerably low compared to issues regarding transport operations and cost of essential services.
2. Key message analysis
Going back to the objectives of publicity efforts — whether the public is aligned with the organization’s communications objectives. Objective-based measurement can be performed by tagging social media comments that are relevant to one’s intended communications messages through machine learning and topic modeling. For organizations with multiple communications messages, such an analysis could also help to determine the various messages that have been satisfied or need to be emphasized in future collaterals.
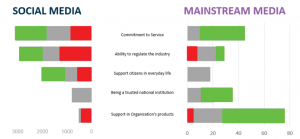 *Sample chart 5 – Key message analysis (hypothetical comms messages) across mainstream and social media. Identify gaps and leverage on opportunities.
3. Segmentation studies
Segmentation studies were typically the hallmark of traditional market research. They require deep diving into personas of each stakeholder group to identify their motivations. However, they are expensive and slow to react. Often taking months to produce actionable findings due to the data gathering process.
In any given day, there are 3.2 billion likes and comments on Facebook, 500 million tweets and 100 million mentions on Weibo. With the sheer amount of diverse conversations available on social media, using social media data for segmentation studies is the next frontier. Being cheap, accessible and quick to react to any new situation — you just need to know where to find the data you need.
At the most basic level, how we use segmentation study for measurement of success is to segment and subsequently, compare the percentage of proponents, as well as detractors towards the organization. This helps management cut through the noise and the spammers, by providing actionable data on unique users and their demographics. Done on a half-yearly or yearly basis, this allows an organization to look at the change in percentage of netizens who are for, and against them, and the reasons for this shift.
Read More: Social is the Unexplored Frontier of Digital Promotions
Going deeper, understanding the psychographics and demographics of each segment allows for a data-driven approach to drive their communications/marketing efforts, maximizing their ROI through knowing (i) who to target; (ii) what are they interested in; (iii) why do they behave this way; (iv) where can you find them; and (v) how to target them.
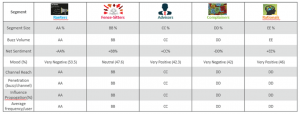 *Chart 6, sample segmentation output. Comparing segment size of each segments.
Enough Said
To close, changing the way an organization has been measuring social media success is going to be a slow and painful process. But just like companies are slowly moving away from PR/AVE in measuring mainstream media performance, in favor of more effective methods, it’s time we do the same for social media.


