For years, marketing teams have relied on various tools and technologies to help them collaborate—from Monday.com and Trello for project management to Assembla and GitHub for web development to HootSuite and TweetDeck for social media management, and many more.
Sales teams in the field also have relied on powerful tools like Salesforce, Slack and Zendesk to help them collaborate and connect with co-workers in the “main office’.
Marketing Technology News:MarTech Interview with Julie Réali, Director of Programmatic Partnerships at Dailymotion
But as remote work became the norm this past year, more stakeholders became involved in the implementation and management of these collaboration tools and processes—from IT teams required to ensure remote access, security and continuity to HR leaders seeking to ensure employee safety and wellness, to managers wanting to make sure teams were engaged and thriving.
In the process, many organizations realized they didn’t have the level of workforce insights they needed to ensure sustained workplace productivity— insights that consistently empower people, optimize processes and maximize technology investments.
I know this from my own experience as Chief Revenue Officer at ActivTrak. We’ve always been a progressive organization when it comes to flexible schedules and work from home policies. However, the challenges of 2020 taught us all new lessons when it came embracing a fully remote and/or hybrid work culture.
As marketing and sales leaders, we often assume that productivity means getting more things done. But it really means getting important things done consistently. This requires us to ask much more nuanced questions about employee engagement and experience, and to visualize their work habits and productivity more holistically—combining activity data alongside sentiment data, such as:
- How long are they working?
- How efficient and focused are they?
- What bottlenecks are they running into?
- What technologies are enablers or distractors?
- Is burnout becoming a factor?
- How are managers helping (or hurting)?
If you aren’t measuring these things, then you probably aren’t managing them. But capturing that kind of information isn’t always easy. It requires looking at data through multiple lenses and doing so in a way that’s unbiased and transparent.
A sales rep juggling two kids at home doing online school is likely to have a much different work schedule than one who is single and lives alone. The goal is to capture those insights in ways that benefit everyone.
Marketing Technology News:Blockgraph Appoints Media and Advertising Veteran Scott Collins as EVP of Client Partnerships and…
Easier said than done.
Workforce metrics can vary widely across employees, teams, managers and executives. The key isn’t whether you’re making 1% or 2% incremental gains in a particular area, but rather to identify and solve for outliers. Seeing information through trends is essential to how you message and manage priorities around workforce productivity and wellness.
While sales and marketing teams may be working longer hours, are they really working wiser?
Not surprisingly, burnout is becoming a growing issue. Endless Zoom calls are sapping employee energy, enthusiasm and creativity. Constant Slack interruptions are disruptive and distracting, negatively impacting focus and output. The question is, how do you identify employees who might be at risk and the activities or applications contributing to it?
At ActivTrak, we use our own workforce analytics software to gauge how we’re doing. For example, our Team Productivity Pulse feature—a visualization dashboard for virtual office operations—provides a real-time snapshot of employee and team productivity throughout the day, including:
- Employees’ real-time availability (active, passive, offline) with color-coded identifiers
- Productivity status by percentage indicators revealing top performers
- Number of hours worked by each employee
- Drill-down reports for additional details on application usage and productivity analysis
- Filters by users or groups to see snapshots of the workday for individuals and teams
Those metrics can get even more granular by individual:
- Which team members are active and which applications are they using?
- Which work tool is each employee using most often?
- What does productivity look like by individual team members?
- Who are the Top Users by productivity percentage?
- What are the top applications used that day?
You can also slice the data by team or functional group:
- What does productivity look like across teams?
- What were the most common work tools they used today?
- Which employees are active or unavailable in a given team?
- What is the average number of hours worked by each team?
- Which employees are today’s top performers on a team?
Not surprisingly, each team is a little different. Marketing may spend more time online in social media apps while sales and customer support may spend more time offline in 1:1 meetings and on the phone. Understanding differences by role or function is critical to establishing appropriate performance baselines and benchmarks. It also eliminates the possibility of misinterpretation or bias—that what you feel or think is going on, may not be the full story.
A growth mindset requires knowledge to be shared. Workforce insights help employees and managers establish a common understanding of what’s working and what’s not, and empower them to improve processes, increase productivity and optimize outcomes through conversation and collaboration.
For marketing this might mean implementing a no-meetings-on-Friday policy to give your writing team more focus time. For sales and support it might mean hiring more reps to keep up with demand while reducing individual phone time and hours worked. Whatever the priorities in your organization, continuous improvement must be intentional. It requires clarity, measurement and accountability, and empowering teams to help themselves.
I know because I’ve seen it work first-hand.
***
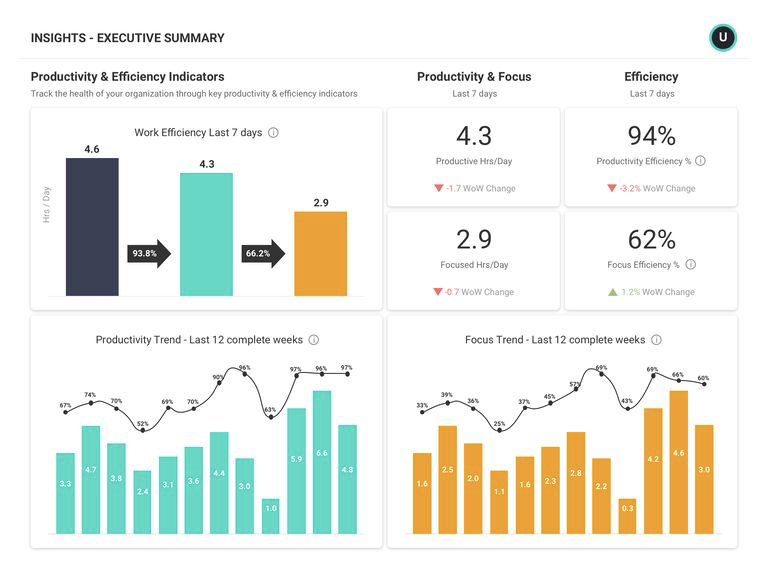
ActivTrak’s Executive Summary dashboard provides quick insights across major productivity indicators including efficiency, focus, workload balance and more. (below)

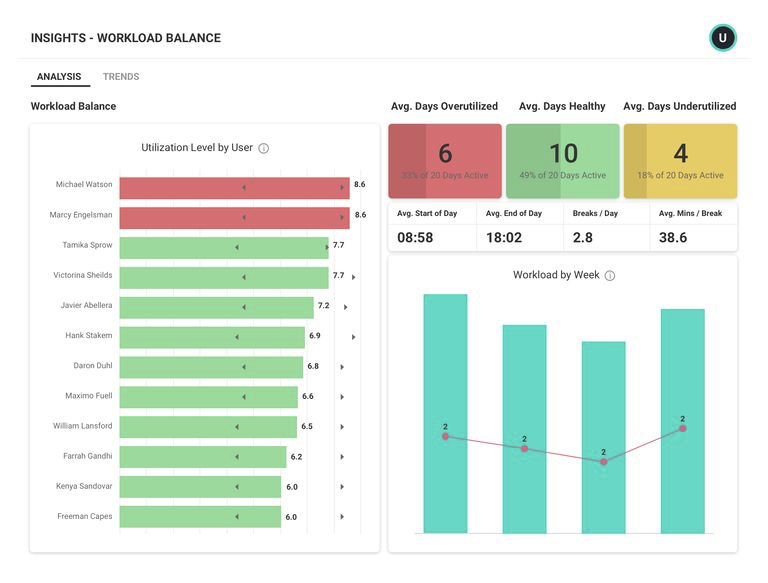
ActivTrak’s Workload Balance Dashboard allows you to quickly Identify employees at risk of burning out as well as those individuals with low levels of engagement. (below)

Marketing Technology News: MarTech Interview with Kim Sneum Madsen, CEO of Umbraco


Comments are closed.