


The Report Intends to Shed Light on the Performance of Digital Marketing Through 2018
A total of $628.63 billion was spent on digital advertising in 2018. Here is an overview that breaks down this spend between four core functions of media advertising. The functions are Google Paid Search, Organic Search, and Social, Display and paid Social, Amazon Ads. All the findings are for the fourth quarter of 2018 with the percentages in YoY unless mentioned otherwise.
Google Paid Search
The fourth quarter of 2018 saw total Google paid search spending grow to 16%. Here are the details distributed among various segments:
Search Ad Spending Paused at 16%
- Investment in Google Search Ads remained steady due to a weaker trend of advertising on Bing and Yahoo
- There was an overall growth of 9% in search ad clicks — slightly lower than the preceding quarter.
- CPC remained unchanged at 7%.
Steady Investment in Google Paid Search
- Google Search Ad spending grew to 18%.
- Click growth emerged as the main focus area, ahead of CPCs.
- While Google Search Ad Clicks doubled to 10% when compared to only two quarters prior, CPC growth declined to 7% as against the same period last year when it had gone up to 14%.
Google’s Shopping Spend Surge
- Shopping ad spend on Google rocketed to 42%.
- Text-ad spending saw a decline at 9%.
- The decline of text-ad spending was specific to retail and e-commerce business.
Also Read: MarTech Interview with Jeff Nolan, CMO, Kahuna
Google Phone Spend Grows
- Search ads for Google browsed on the phone also grew to 42%.
- The main reason for the same was the growth in phone impressions — growing to 107%.
- While desktop Google dropped to 5%, tablets saw an increase at 3%.
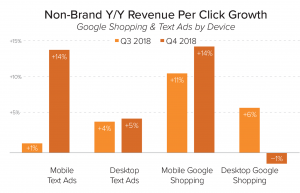
Increasing per Click Revenue Across Most Ad Segments of Google
- Average revenues grew by around 14% for both, mobile text as well as mobile shopping ads.
- On the browser, text ads grew by 5% while shopping ads dropped to a percent.
2019 Will See a Drop in Search Partner Share for Google
- Search partners were responsible for 7% of shopping clicks for Google.
- This is likely to drop in 2019 as Yahoo is switching to Bing as a preferred partner
- Partner share has been declining for Google since the last few years to as low as 2%.
Audience Targeting Initiatives of Google Backfire
- Google’s audience targeting tools were responsible for 38% clicks for its shopping ads.
- Now with Apple’s launch of similar targeting products, click through rates for some of Google’s targeting tools have fallen.
Mobile Devices, iOs, and Safari Are Driving maximum Search Ad Clicks
- Tablets and mobile devices are driving two-thirds of Google Search Ad
- 46% of US Google Search Ad Clicks came from iOs.
- Safari (desktop) was instrumental in a 5% contribution towards Google Ad clicks.
- Google generated 98% of ad search revenues through mobile.
Also Read: Google and YouTube Advertisers Get New Ad Sales Metrics
Social and Organic Search
Organic searches were barely responsible for about 26% of all site visits. The main reason for this is cited as aggressive initiatives by brands to advertise on paid channels. Site visits from Facebook grew to 19%, while Instagram exploded with growth numbers of 123%. Pinterest recorded a modest site visit of 1%. In the US, Google resulted in 96% of organic traffic, mobile amounting to 93% — the percentage stood at 61% globally.
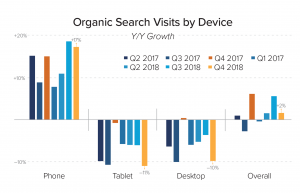
Organic Search Stronger via Phone Than the Desktop
While Q3 saw a rise of 6% in organic traffic, Q4 dropped to only 2%. Phone organic searches amounted to 17% with a visible decline in organic visits from tablets and desktop browser.
DuckDuckGo
DuckDuckGo, the latest search engine hitting the market, grew 64% in direct queries when compared with the same time around a year ago. Organic searches rose to 34% with 75% of this coming from mobile phones.
Social media contributed to 3.4% of site visits — Facebook being the largest contributor towards it. Mobile phones contributed to 4.6% of site visits.
Recommended: Google Shopping ads are gaining in popularity and Amazon continues its steady growth
Social media used on phones and tablets generated 78% site visits — mobile drove 57% organic and 64% paid visits.
Paid Social and Display
Facebook, Instagram, and Pinterest drove the maximum paid media in the period. Ad impressions and CPM grew by 5% with spend growth slowing down at 10%. Instagram continued to generate major revenues for Facebook (27%). Spend, impression value and pricing grew steadily for Pinterest.
- Against popular perception, advertisers are not pulling off campaigns from the platform due to negative news — it’s more a problem of Facebook not being able to upgrade their platform to pick up more ad load.
- 91% of clicks and 86% of spending came from mobiles and tablets for Facebook Proper.
- Newsfeed and right-hand rail click through rates grew 18% and 15% respectively.
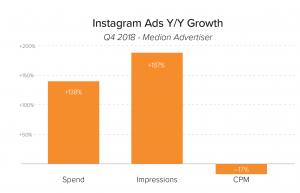
- Advertisers, during this period, increased their spend on Instagram (138%), thanks to its stories feature.
- Advertisers spend 27% more on Instagram than Facebook. Almost all of consumer spend and clicks came from the mobile for Instagram.
Compared to Q4 2017, advertisers spent 100% more on the platform. Pinterest campaign management and reporting are not at par with the likes of Facebook or Instagram, however, advertisers remain hopeful.
While traditional advertising saw 2% growth, paid social media advertising grew by 31%. Video has superseded traditional display advertising — 90% consumer spending was based on the fact that promotions were made in video instead of display.
Amazon Ads
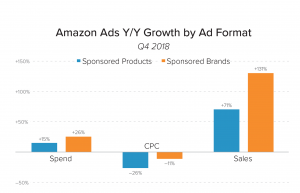
Amazon’s sponsored products and sponsored brands grew by 15% and 26% respectively. Advertisers spent 86% on sponsored products. Brand keywords sold 64% sponsored Brands and 47% of sponsored products. Here are the key takeaways for Amazon ads:
- Sponsored products saw sales of 71% while sponsored brands sales were at 131%.
- Sponsored products sold the most among all of Amazon’s ad formats.
- Product display ads shrunk to 1% in spending. Maybe because this channel is only available for first – part vendors.
- Amazon’s product descriptions garnered 29% clicks.
- Brand keyword insertion accounted for 40% of sponsored brands clicks while sponsored products got clicked 27%.
- Since sponsored brands recently received new placement from Amazon, the same contributed to 12% of ad spend.
- Sponsored brands got clicked more than sponsored products.
- Amazon ads convert better than Google Shopping. On the other hand, click-through rates are far better for Google when compared with Amazon
2019 has started on similar statistics. It will be very interesting to see what the numbers will be for Q1 2019. Tell us what you think at news@martechseries-67ee47.ingress-bonde.easywp.com.
Recommended Read: MarTech Interview with Jeb Ory, CEO, Phone2Action


